A Conversation on Portfolio Visualization: A Novel K Tool for Analyzing Narrative-Informed Portfolios
This conversation took place on the 1st of April, 2026, when we, Kateryna and Julia, sat for one hour to try out the recently launched digital platform (K Tool) for analyzing and visualizing narrative-informed portfolios for the case of the Basque Science, Technology and Innovation (STI) Policy. In this conversation, we aimed to explore the current functionality of K Tool and identify possibilities to develop its visual and analytical features further. Kateryna is a researcher who investigates various approaches for transformative portfolios, but doesn’t have previous experience of using the K Tool and therefore was acting as a user who is trying to get through the new tool, and understand its logic better. Julia has been partially involved in the design and development of the K Tool and has used it within other projects, she therefore provided clarifications and shared reasoning behind the inclusion of different features.
Key takeaways:
Key questions for colleagues: In ALC, our ultimate goal is to move narrative-informed portfolios from a theoretical ideal to an operational reality. We are working toward a future where digital tools like K Tool don’t just store data but actively build the social innovation capabilities of institutions—collectively learning how to map, listen, and navigate the friction of change. We would like to have a further discussion with portfolio practitioners and researchers, no matter what approach to portfolio they use, as soon as they are interested to compare and contrast prototypes, failures, and insights. We are thinking about such questions as:
|
Kate: It will be very interesting to try out this tool now with you, Julia. I’m familiar with the ALC approach to narrative-informed portfolios to some extent, I remember first encountering it in 2020-2021, when following the work of the Strategic Innovation Unit of UNDP in different countries, when one of their approaches to portfolio design was based on the work of ALC. But the K Tool is new to me. I don’t have any specific order in which I want to ask you my questions, let’s just open the tool and look at the visuals.
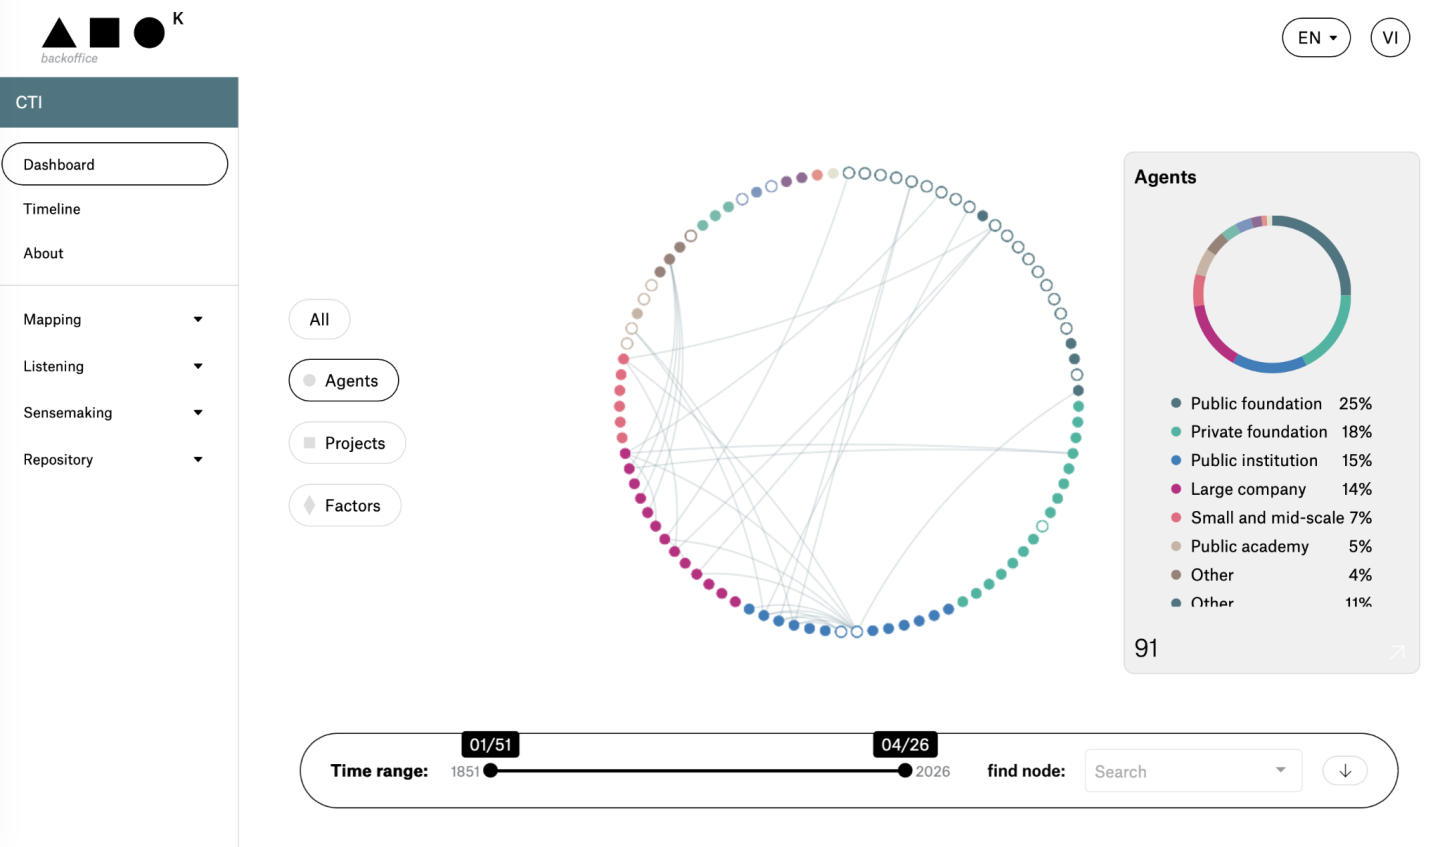
Figure 1. Main Dashboard of the K Tool. Interconnections across agents
Julia: Sure, let’s do this! The K Tool for the Basque STI project was launched just a few weeks ago, it now includes most of the information we collected so far — until now, we had conversations with more than 100 people. But we keep on updating it all the time, as information comes in.
Kate: Maybe, we can start by looking at the visual that one would see first when opening the Dashboard. Here we can see portfolio structure, which is colour-coded: different colours are attributed to projects, actors, and also factors.
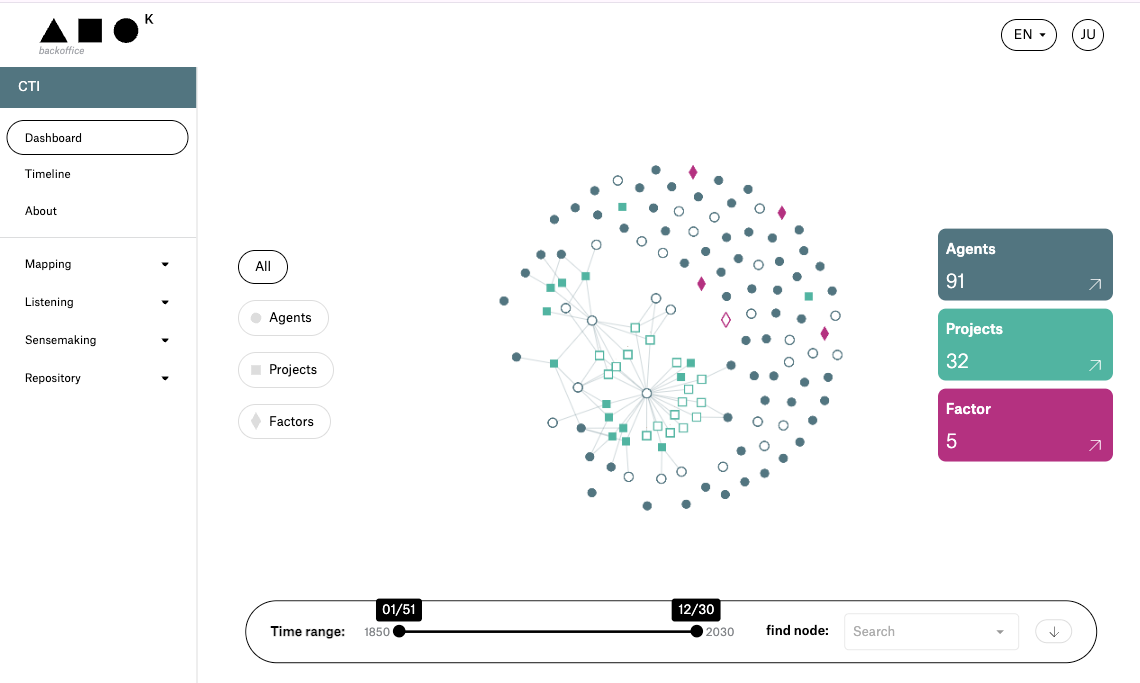
Figure 2. Main Dashboard of the K Tool. Portfolio visualization including agents and projects
While it is intuitively easier to understand the first two, maybe we can talk about the factors - what are they? I looked at “Timeline” and it seems that these factors are certain events that influenced the STI policy, right? Kind of change-makers? But I was not sure I understood how exactly they influenced the portfolio. Does K Tool allow us to connect them somehow to the portfolio composition? What can we learn about this interrelation from the K Tool?
Julia: That’s right, for the factors our thinking was that there were some structural or conjunctural events happening and we wanted to understand how the whole system organized itself to respond to those “shocks”. From the K Tool we can see what are these factors for the Basque STI case.
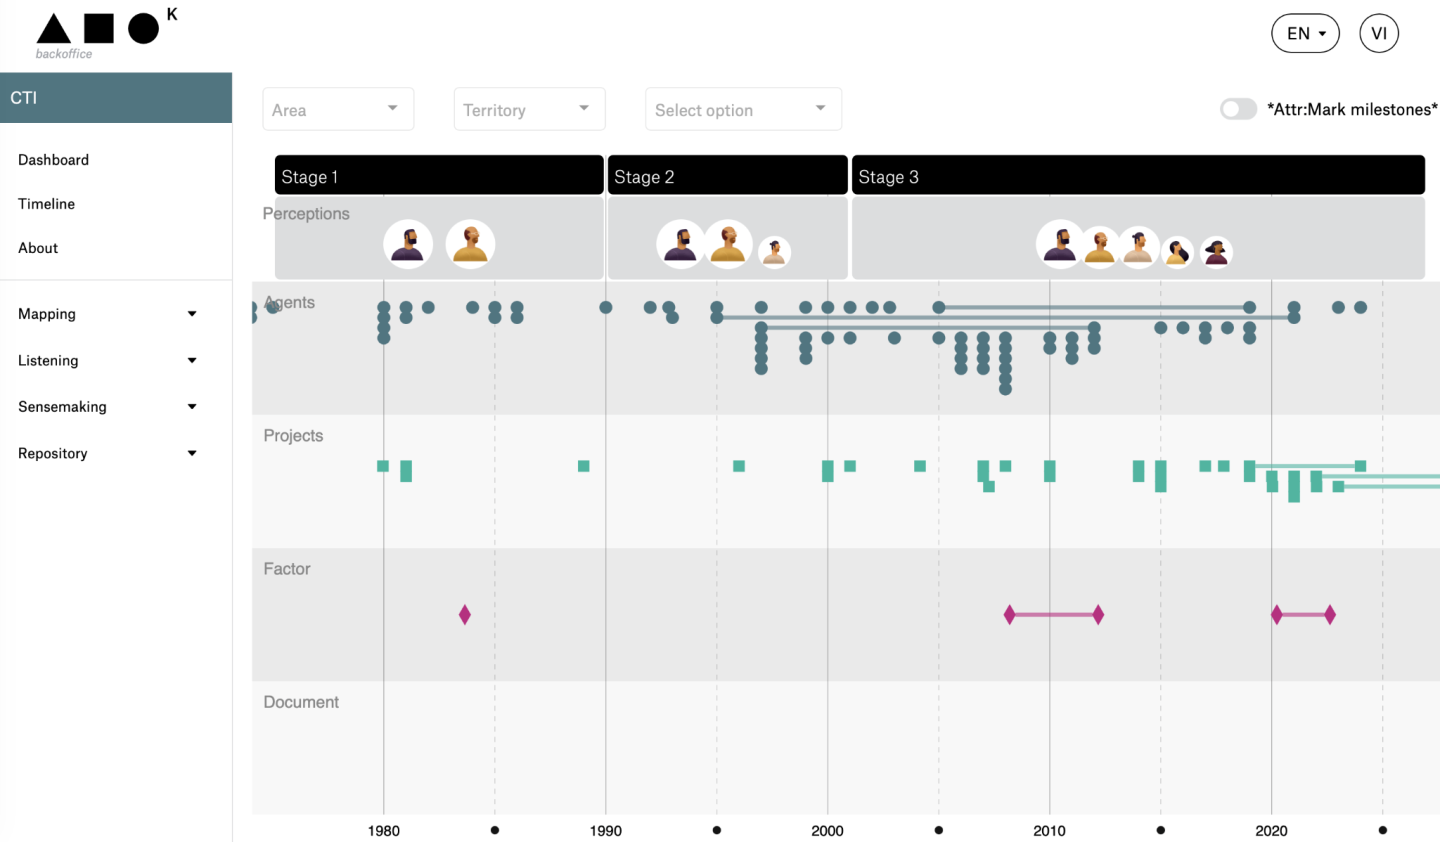
Figure 3. Timeline of the Basque STI portfolio evolution
For example, the financial crisis in 2008 - we can see that after that moment, the narratives diversified. So if you look at the timeline and check how many personas are visualised for different stages, you will see that while it was only 2 for the first stage and 3 for the 2nd, for the third - it was already 5. This means that initially there were only two main narratives about the policy system when there was a stronger shared understanding of what was going on and how the future looked like. For instance, the welfare state was largely understood as being directly linked to wealth creation—closely aligned with industrial growth and with the Basque Country’s tradition of pragmatism.
Kate: Aha, now I understand: the number of personas associated with each stage corresponds to the number of patterns of narratives you identified from the listening process. Visually, it was not very clear for me where the factors are located in relation to the boundaries of different stages, so I struggled to make sense of where to see what has changed. For example, for the economic crises - it looks like it occurred during Stage 3, not that Stage 3 emerged from it. How were those stages identified?
Julia: Yeah, this is an interesting finding of our process. Most of the people we talked to agreed that it was three stages in the development of the Basque STI system. Whenever you ask them what happened, how the STI system was put in place, everyone describes the same sequence. They say there was a first stage that lasted until the 1990s. And it’s actually quite striking: we had to build a new system from scratch, focusing on reinforcing the industrial fabric that already existed. The path we didn’t take was strengthening the scientific system—simply because there wasn’t one. In that sense, the case of Catalonia is the opposite. What they did was reinforce their scientific system. Then, in the 1990s, interviewees agreed that a new phase began. It wasn’t only about what we could offer anymore, but also about what was being asked for—so the relationship between supply and demand. And then comes the third stage, when there is a process of specialization within the STI system, because all regions in Europe were encouraged to do that. At the same time, there’s also an internationalization process. So these two dynamics were happening together, and there was both cooperation and competition at the same time within the Basque system. Those are really the defining characteristics of this third period. And everyone more or less agrees on this. But when it comes to what’s happening now, we started to see that there’s no longer that same agreement. Everything has become much more complex—because of the crisis, digitalization, gender perspective, and so on, questioning what the welfare state actually is and how STI policies contribute to that: is it about how we continue to generate wealth, or how the system has the capacity to address increasing inequalities? Now there are multiple narratives and before, things felt much simpler.
Kate: I see, the system is now perceived as more complex and we can see this in the K Tool in the number of narratives (personas) associated. I still wonder if the analysis based on the identification of those 5 factors can challenge this dominant perception that it was these three stages? Or it just adds granularity and allows us better understand what was also happening during different stages?
Julia: If you look, for example, at the upper right corner at the Dashboard—there are milestones. Many of the infrastructures that were created can actually be understood as milestones that help define when each stage begins and ends. For instance, Stage 1 begins with a major institutional shift. In the 1980s, with the Statute of Autonomy, the region gained the competencies to start building its own system—especially new infrastructures. That was a key moment. So what we tried to do is identify both the factors and the milestones that help explain what was happening. And the creation of infrastructures, at that time, became an important element to track that evolution.
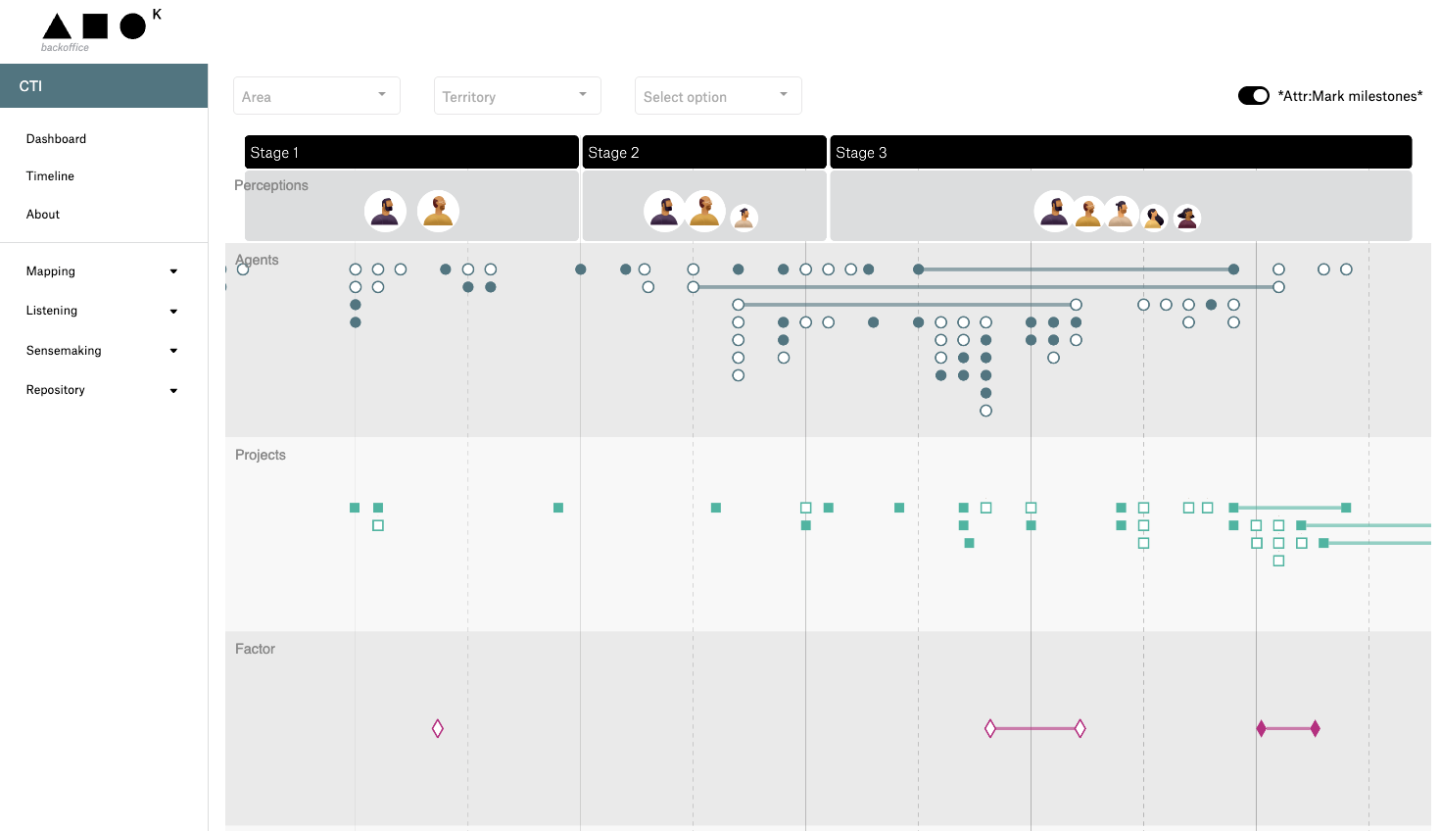
Figure 4. Visualisation of Basque STI portfolio over three stages identified, including milestones
Also, what we see is that each stage responds to a dominant narrative. In Stage 1, the narrative was very much: ‘we need to invest in industry’. So most of what was supported reflected that. Then in Stage 2, a new narrative emerged—one that brings science into the picture. And you can clearly see how projects and actors begin to align with that. And in Stage 3, the same logic applies again: as the number of narrative broadens, the supported initiatives diversify accordingly—shifting from a focus on technology to a wider range of initiatives that position science as a generator of value, as well as initiatives that incorporate a gender perspective or reflect the values of younger generations.. So the visualization in the K Tool is really trying to show how actions respond to narratives over time, and how narratives shape actions as well in the development of the whole system.
Kate: And these personas… is it possible to read a description in K Tool of what narratives they represent? Because right now it seems like we only see their names.
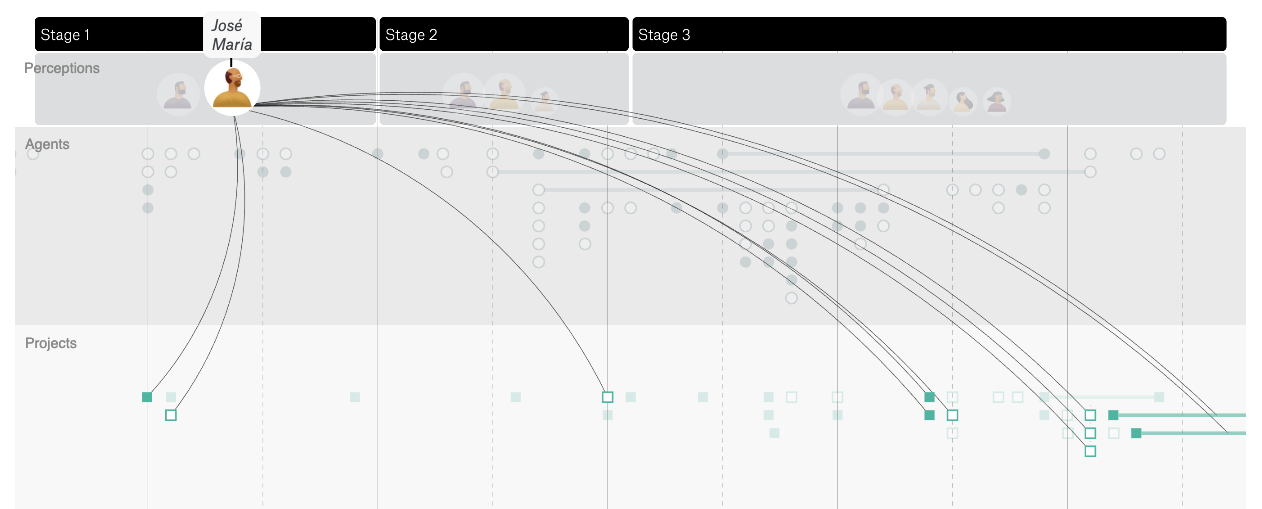
Figure 5. Visualisation of the interconnections between projects in a portfolio and meta-narratives identified
Julia: Yes—each persona represents a pattern of perception, it’s essentially the core conclusion, or meta-narrative. In the iceberg model we use in ALC, this corresponds to what lies beneath the visible public discourse. Then, if you go into the details of each profile, you’ll see all the different quotes, perceived opportunities and challenges associated with each persona. Each narrative is actually supported by thousands of quotes—literal quotes—which you can read in the K Tool.
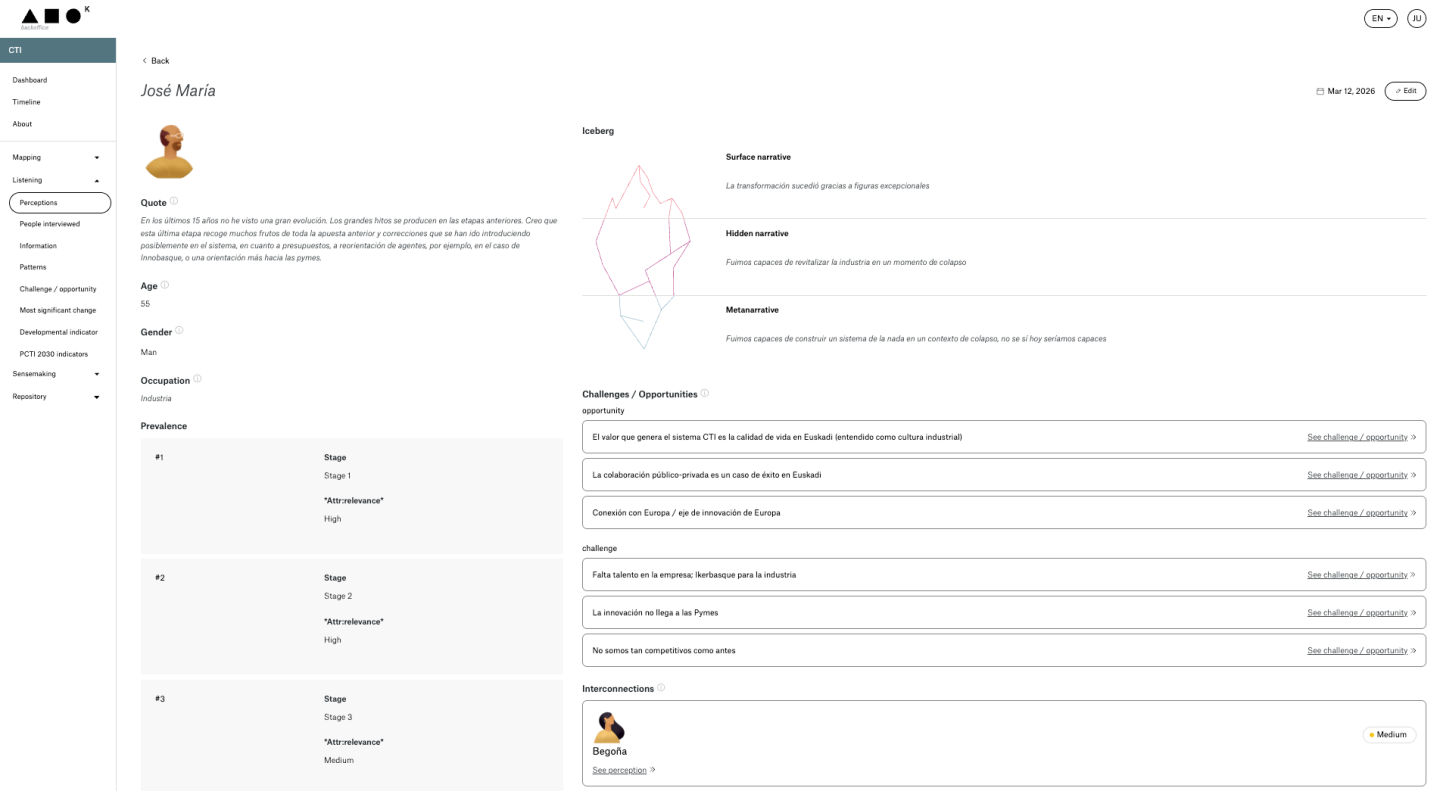
Figure 6. Meta-narrative visualized as an ethnographic profile, along with representative quotes
Kate: Yeah, I think this short description of the meta-narrative is really helpful. Because when you use names, people tend to interpret them in a certain way. Many are familiar with design thinking, where personas are usually linked to personal traits or individual characteristics. But here, the ethnographic profiles represent narratives rather than personal identities, so they’re less ‘personal’ in that sense. That can feel a bit counterintuitive.
Julia: Yes, and another important aspect relates to how prevalence is communicated in the K Tool. For example, in Stage 1, the figure of José María appears larger, whereas in Stage 3 it becomes smaller. This reflects the relative prevalence of that narrative within the portfolio over time.
Kate: Good to know this, since this is not very intuitive. If you don’t already know that size has this meaning, it’s not very easy to notice or interpret it this way. Maybe you pick it up subconsciously, but you don’t really realize what it stands for. At least for me, I didn’t immediately understand that the size of the avatar represents its relative importance in the portfolio.
There is one other thing I noticed is that the personas are a bit hard to interpret at first.
Julia: Yes, we’ve been thinking about that. At some point we even considered removing names and avatars altogether—just using labels like “industrial,” “scientific,” “institutional,” “gender,” or “new generations.” For example, the “new generations” pattern is trying to capture the idea that younger people often don’t feel part of the system anymore. This wasn’t really the case in the 80s, when there was more of a shared understanding of what was going on. But now, with all the demographic changes it's becoming much harder to include these different voices. And if we think about managing STI policies in a more dynamic way, then involving all these different parts of society becomes really important.
But the personas also serve a purpose—they remind us that these are real perspectives, with actual people behind them, not abstract categories.
Kate: Yes, I think that human element is important. But maybe the naming could be slightly adjusted—so it reflects the narrative more clearly. Because in the end, these are not demographic categories—they’re ways of seeing the world. Even if a name sounds “old-fashioned,” it doesn’t mean the people sharing that perspective are necessarily old-aged.
Julia: Exactly. It’s more about worldviews than individuals. That’s the key point.
Kate: Can we get back to the categorization you mentioned earlier, when you work with data collected through the listening process - multiple interviews you run. I wonder, who does this categorization? Is it like a coding system? Do you do it manually, or is it already supported by AI?
Julia: Until now, everything has been manual. We go quote by quote—this is similar, this is different, this corresponds to that. Then we define patterns. For example, we might identify five patterns, each represented by an ethnographic profile. After that, we validate them through collective sensemaking sessions, to reduce bias. Participants tell us: this makes sense, this doesn’t, you’re missing this voice. And then we continue the listening process and update the analysis. But now we’re at an inflection point. We’re starting to train AI to generate a first draft of these patterns. Then we’ll refine and correct them. So far it’s been manual—but that’s about to change.
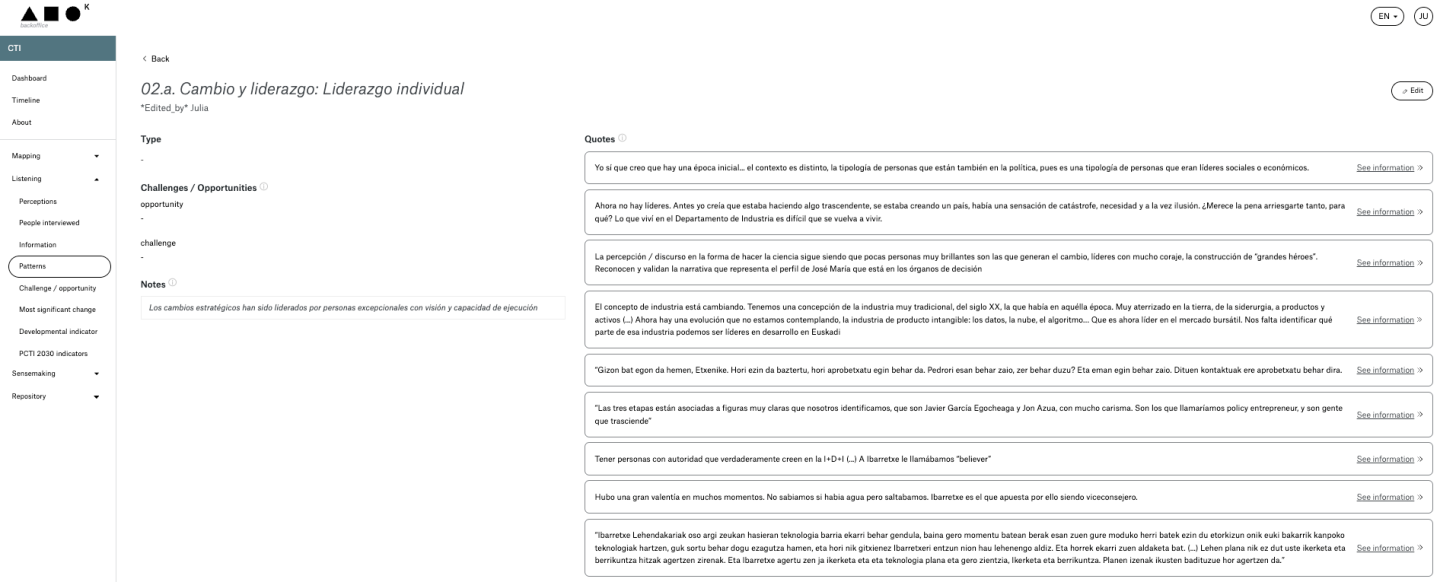
Figure7. Quotes associated with a meta-narrative
Kate: And these sensemaking sessions that you mentioned—are they internal or external? Who is involved in them?
Julia: Mostly external. Last year we organized two main sessions within the Basque STI project: one with key stakeholders—like Ikerbasque, the European Union, the Basque Government, universities—and another one only with female researchers and innovators. And that second session was very important. They told us: “This narrative reflects voices of power. You’re missing the voices that challenge these policies.” So we expanded our listening process. In a couple of weeks, we’ll run another session with research students.
Kate: How do you decide what to show during these sessions?
Julia: We show them the ethnographic profiles. We explain: we interviewed 100 people, extracted around 1,000 quotes, and identified five patterns of perception. Each pattern is an ethnographic profile. Then we ask: Do you recognize these? What’s missing? That’s essentially the structure of a sensemaking session.
Kate: So validation means recognition?
Julia: Exactly. They recognize that these perspectives exist within the system. For example, in the “Contrast session” module in the K Tool you can see this was the first sense making session that was conducted in-person. Here you can see which stakeholders participated, what was said during the session – the literal anonymized quotes. And we also reference the ethnographic profiles that were validated.
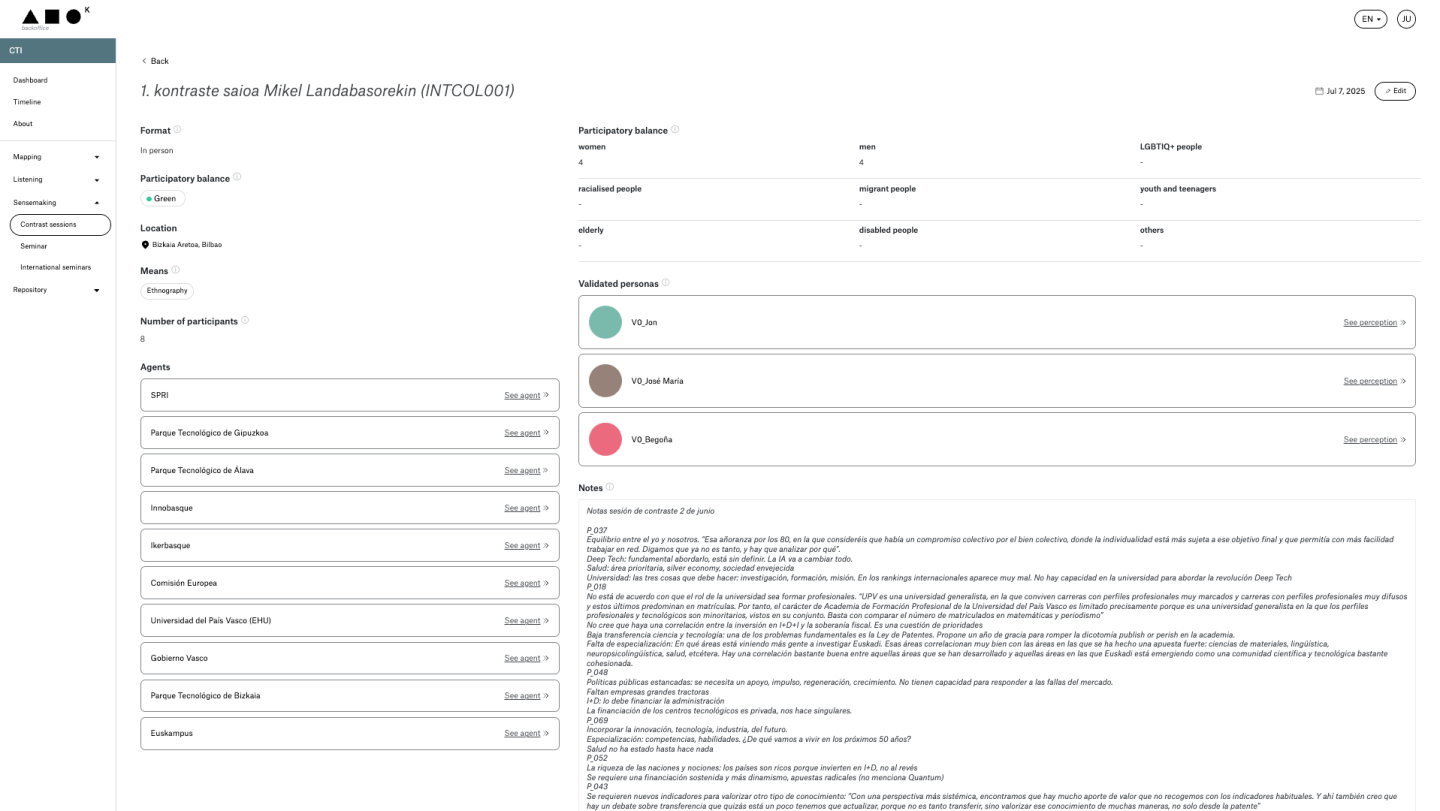
Figure 8. First sensemaking session held in June 2025, representative quotes
Kate: Let’s talk more about the use of AI in the K Tool that you mentioned. I think what you’re doing with AI—and with this more digital approach—really makes this methodology for portfolios much more applicable. You know, we’ve discussed this before, for example, such actors like you UNDP might see the narrative-informed approach to portfolios as very complex in practice, and something that’s hard to implement in scale, especially if people are not trained for it. So if you continue developing this tool—with automated analysis and more processes being supported by AI—it feels like a real step forward. It could make narrative-informed portfolios actually usable more widely. Because right now, it’s an immense amount of work. And I can imagine that if people fully realize what it takes, it might even scare them off a bit.
Julia: Yes, this is exactly the discussion we keep having with collaborators and partners. Many participatory processes don’t really involve listening. And for us, listening means this level of effort. This is what it takes to really listen. When we show them how we work, they say: this is too much work. So the key question becomes: when designing portfolios, is listening a cost—or is it an investment?
Kate: And I think this is also an important question for research. How do we better show what this approach actually does? Whether in terms of transformative potential, or its overall impact on policy processes. Because yes, you can have a very deep analysis and a very rich understanding—but then what? You mentioned that people sometimes feel overwhelmed by the complexity. I’ve seen the same with my students: when they realize how complex things are, they get stuck, don’t know what to do. Instead of feeling empowered, they feel almost paralyzed. And I think the same can happen with policymakers. If something feels too complex, they might just try to avoid it. So it’s really important to show how this kind of analysis leads to actionable insights—something that actually empowers people to act.
Julia: Yes, let me show you something. This is where we try to make complexity operational. On one side, we have the ethnographic profiles—the validated narratives. On the other, we have the initiatives mapped in the Basque STI system (stakeholders, projects, interventions, policies…). And then we cross/juxtapose them. We look at which initiatives address which needs. That’s how we identify gaps in a portfolio. For example, at the community level in the Basque STI portfolio, there is almost nothing—only one initiative responding to identified needs. But on the regulation level, there are many. We also see that the system mainly responds to dominant narratives—what we call the “voices of power.” These are the ones pushing for continued industrial development, just like in the 1980s. So the system keeps reinforcing the same narratives—unless you actively introduce a listening process that brings in underrepresented voices. Otherwise, you just keep doing what you’ve always done. So, this is like the closest exercise that we have done to address your last question, and we think there is still much more work to do here. But this is what we understand as a narrative-informed portfolio so far.
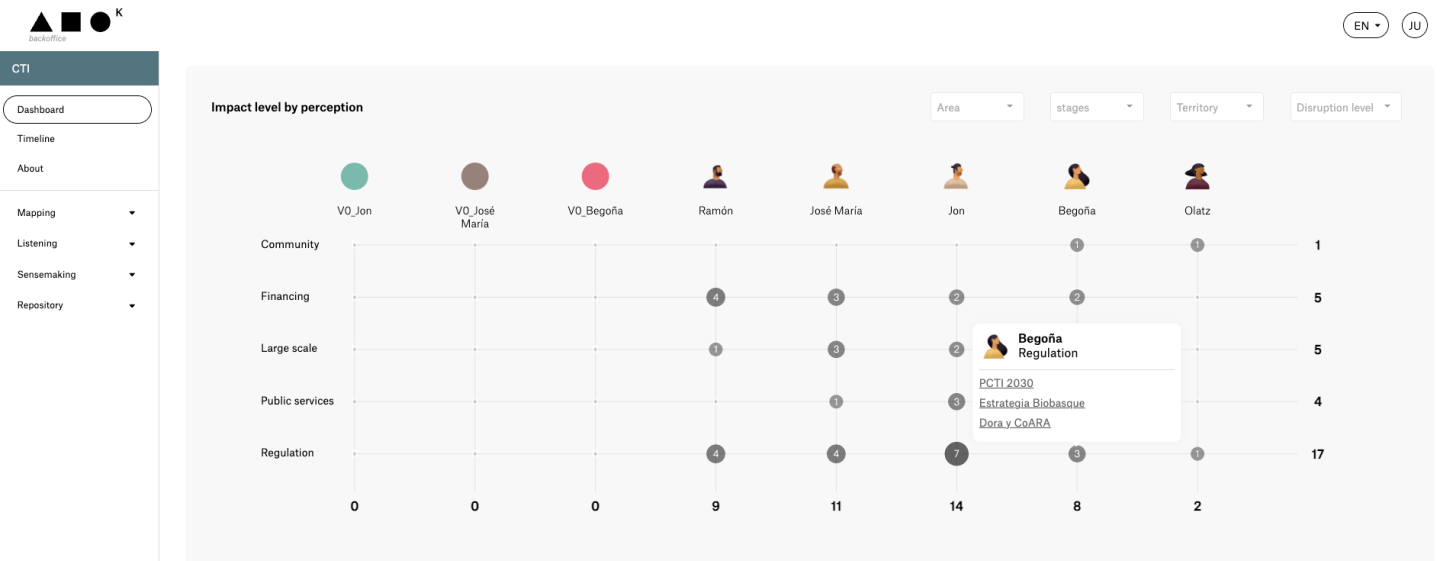
Figure 9. K Tool allows to juxtapose projects and initiatives included in a portfolio and meta-narratives identified, this is visualised as such a matrix
Kate: That really helps answer the question of actionability. Maybe this has to be placed on top of the Dashboard or somehow linked from the man page, as this seems to be one of the key analytical outcomes that K Tool helps to produce.
Talking about the overall usability of K Tool, I guess the challenge is that it is not meant to be immediately intuitive for everyone. Many research tools are like that. But maybe in the future, you could include tutorials, short videos, or some kind of guidance for new users.
Julia: We’re actually planning to include an AI assistant. You’ll be able to ask questions like: “What does “pattern” mean?” or “What’s happening in Stage 1?”—and it will guide you. So the tool becomes not just analytical, but also a learning space for stakeholders who are collectively addressing the very same complex challenge. A way to develop capabilities: how to listen, how to map, how to analyze and make sense of the information.
Kate: That’s very interesting. Because the tool is then not just an output—it’s part of a broader process. For example, after a sensemaking session, someone could go back and explore the data more deeply on their own.
Julia: Yes, and even before the session—you could ask the AI assistant to explore certain narratives in advance. Ask: “What do I need to know for this session?” or “What are the gaps in the system, according to narratives?”. It works like ChatGPT—but based on your own data sources, your own listening process.
Kate: That’s quite powerful. I think it would be great to document this—maybe write a short piece with screenshots and reflections. Something we can share, publish, and use to engage others—especially people working on portfolios. Because once you start talking about portfolios, everyone has their own interpretation. And visualization quickly becomes a way to compare approaches.
Julia: A key question for us concerns how the portfolio is currently visualized and evaluated: what is missing in the existing network representation, and how it could be further developed or improved. At present, there is significant room for refinement, particularly in making it function more clearly as a narrative-informed portfolio. But sure, let’s bring this conversation up to the wide community and see if we can initiate a further discussion about portfolio visualization!
1 Over the coming decades, the ageing of the population will intensify, and by 2045 almost one in every three residents will be 65 or over. The migratory balance as a result of both immigration and emigration,
would bring in 12,700 people per year throughout the period 2025-2044, as a result of exchanges with countries abroad [Eustat].